Overview of Poverty Around the World and Analytical Discussion of Poverty in the United States
Sunny Onyiri
Abstract
This paper examines the meaning of poverty, poverty in different parts of the world, the causes of poverty, and presents an analytical presentation of poverty in the United States.
In many countries, poverty may be defined by income only. Countries, states or even counties may set poverty lines. People who live below these lines or just above them might be considered impoverished, while those who live well above the line are clearly not. While this may be one way to evaluate how to help those with little, there is significant debate about where these lines should be set.
While poverty occurs in many parts of the world, its effects are more noticeable in the less developed nations. Among the many causes of poverty are war and natural disasters. In the less developed nations, poverty can also be attributed to colonial rules, environmental degradation and the centralization of power in the hands of few elites.
In 2008, 39.9 million people were considered poor in the United States. The poverty rate in the States varied among the racial groups, region and age. There are no quick fixes to the problem of poverty. However, economic growth and access to education at all levels are some of the solutions to solving the poverty rate in the United States.
Poverty in Industrialized Countries
Poverty is a global phenomenon. No matter where one goes, individuals living in absolute poverty will never be far away. As defined by the American Heritage Dictionary, poverty is “the state of condition or condition of being poor; lack of the means of providing material needs or comforts; lack of something necessary or desirable; insufficiency . . .”1 Those looking for definitions of poverty are likely to find many more, and even find specific poverty tests which are administered to determine statistics, including the world poverty rate or the number of children that are in an impoverished state. The term poverty itself is somewhat slippery to define, and may have different meanings depending upon country of origin. In principle, it can be thought of as the state of lacking resources that would provide people with basic necessities or that force people to go without certain needed things, such as three meals a day or shelter. Yet it ought to be understood that people can still have some of these things. For example, roofs over their heads, and yet not enough of other things, including food, money to seek medical treatment, or to purchase adequate clothing. With the exception of the Organization for Economic Cooperation and Development (OECD) countries – highly industrialized countries such as the United States and Britain – extreme poverty exists in practically every country on earth.2 In 2001, 2.7 billion people were living on less than $2 a day, and 1.1 billion people were living on under $1 a day.3
Poverty in industrialized nations is also an important issue. While many poor in wealthy countries may not be in absolute poverty, as many poor people in developing countries, the relative poverty and high inequality in many wealthy nations creates significant issues. The gap between rich and poor has grown in more than three-quarters of the world’s wealthiest countries since the mid-1980s, according to a study of income inequality and poverty by OECD released in October 2008.4 In addition, the study finds that the economic growth of recent decades has benefited the rich more than the poor. The study also found that the past five years saw growing poverty and inequality in two-thirds of OECD countries. Canada, Germany, Norway and the United States are the most affected.
As summarized by an OECD briefing, the average income of the richest 10% of people across its’ own countries are nearly nine times that of the poorest 10%. For example, the top three countries with the highest income gaps are:5
- Mexico – where the richest have incomes more than 25 times those of the poorest
- Turkey – where the ratio is 17 to 1
- USA – where the ratio is 16 to 1.
- Portugal and Poland also have large gaps, making it the top five, but their gaps are not as large as the first three.
For many years, the United States was regarded as having the largest gap between rich and poor of any industrialized nations, but the group of industrialized nations has slightly grown since then to include Mexico and Turkey. In Nordic countries, however, such as Denmark, Sweden and Finland, the gap is much smaller. The incomes of the richest 10% average around five times those of the poorest 10.6
Poverty in Different Regions of the World
Poverty does not affect every region of the world equally. Some regions, such as sub-Saharan Africa, are completely devastated by poverty, while others, such as Latin America, are not affected to the same degree. The following is a summary of poverty level in different region of the world.
- There are approximately 534 million people living in the Latin American/Caribbean area. Of these, 132 million live on less than $2 a day, and 57 million live on less than $1 a day. However, the situation is improving – Latin America is experiencing high economic growth as demand for its products increase Unfortunately, though the region is making progress, Latin America is one of the most unequal regions. A World Bank research team investigating inequality in the area found that “the richest one-tenth of the population of Latin America and the Caribbean earn 48 percent of total income, while the poorest tenth earn only 1.6 percent.7
- Eastern Europe and Central Asia – home to many former Soviet republics – have a population of about 471 million people. Of these, 20.3%, or 97 million, live on less than $2 a day, and 24 million live on less than $1 a day.8 The situation is rapidly improving in these countries and many have been or are now being accepted into the European Union, resulting in the region’s economy showing steady growth. From 1999 to 2003, 40 million people escaped poverty. The nations of Eastern Europe and Central Asia are sometimes regarded as ‘transitioning’ countries: while they are lagging in poverty alleviation and human development now, they are expected to close this gap within a few decades.9
- There is no place where extreme poverty is more evident than sub-Saharan Africa. Almost 50% of the population lives on under $1 a day – the highest rate of extreme poverty in the w Thirty-two of the 48 poorest countries in the world are located in this region, which is plagued by conflicts, lack of functional governments, and terrible diseases, such as HIV/AIDS and malaria. Sub- Saharan Africa is one of the few places that is not making progress on the Millennium Development Goals – the number of impoverished people has doubled since 1981 – and is perhaps the most important region in the fight against poverty.10
- About 23% of the population in North Africa and the Middle East live on less than $2 a day, but only 2.2% (six million people) live on under $1 a day – very different from its neighboring regions in the south (sub-Saharan Africa) and the east (Southeast Asia). However, many of the economies in the region are based almost completely on one product – oil – and must diversify to increase living standard Also, there is a high rate of unemployment, and gender equality in education is lacking.11
- The East Asia/Pacific region is home to nearly two billion people, making it one of the most populous regions on ea About 50% of the population live on less than $2 a day. Due primarily to huge economic and social advances by China, however, the number of impoverished people in the region has dropped greatly in recent years, and continues to improve, even as the overall population continues to grow.12
What Causes Poverty?
Warfare contributes to more entrenched poverty by diverting scarce resources from fighting poverty to maintaining a military. Take, for example, the case of Ethiopia and Eritrea. The most recent conflict over borders between the two countries erupted into war during 1999 and 2000, a period when both countries faced severe food shortages due to drought. The material and human destruction caused by warfare has been a major development problem. For example, from 1990 to 1993, the period encompassing Desert Storm, per capita Gross Domestic Product (GDP) in Iraq fell from $3500 to $761. The drop in average income, while a striking representation of the drop in the well- being of the average Iraqi citizen in the aftermath of the war, fails to capture the broader effects of damages to the infrastructure and social services, such as health care and access to clean water.13
People who rely on the fruits and vegetables they produce for household food consumption (subsistence farmers) often go through cycles of relative abundance and scarcity. For many families that rely on subsistence production for survival, the period immediately prior to harvest is a ‘hungry period.’ During these periods of scarcity, many families lack sufficient resources to meet their minimal nutritional needs. Being familiar with these cycles has enabled development practitioners to anticipate and prepare for periods of acute need for assistance.14
Besides the immediate destruction caused by natural events, environmental forces such as droughts and flooding, often cause acute periods of crisis by destroying crops and animals.15 Other natural disasters, including hurricanes and earthquakes, have devastated communities throughout the world. Developing countries often suffer much more extensive and acute crises at the hands of natural disasters, because limited resources inhibit the construction of adequate housing, infrastructure, and mechanisms for responding to crises.16
In addition to warfare, insufficient food production and natural disasters, there are other entrenched factors associated with poverty. These include:
- Colonization: One of the most important barriers to development in poor countries is lack of uniform, basic infrastructure, such as roads and means of communicatio Some development scholars have identified colonial history as an important contributor to the current situation. In most countries with a history of colonization, the colonizers developed local economies to facilitate the expropriation of resources for their own economic growth and development.17
- Struggle and centralization of power: In many developing countries, political power is disproportionately centralize Rather than a network of political representatives distributed equally throughout society, in centralized systems of governance one major party, politician, or region is responsible for decision-making throughout the country. This often causes development problems. For example, in these situations politicians make decisions about places that they are unfamiliar with, lacking sufficient knowledge about the context to design effective and appropriate policies and programs.18
- Corruption: Corruption often accompanies centralization of power, when leaders are not accountable to those they serve. Most directly, corruption inhibits development when leaders help themselves to money that would otherwise be used for development projects. In other cases, leaders reward political support by providing services to their followers.19
- Destruction of natural environment: Awareness and concern about environmental degradation have grown around the world over the last few decades, and are currently shared by people of different nations, cultures, religions, and social classe However, the negative impact of environmental degradation is disproportionately felt by the poor. Throughout the developing world, the poor often rely on natural resources to meet their basic needs through agricultural production and gathering resources essential for household maintenance, such as water, firewood, and wild plants for consumption and medicine. Thus, the depletion and contamination of water sources directly threaten the livelihoods of those who depend on them.20
- Class system and social inequality: One of the more entrenched sources of poverty throughout the world is social inequality stemming from cultural ideas about the relative worth of different genders, races, ethnic groups, and social classe Ascribed inequality works by placing individuals in different social categories at birth, often based on religious, ethnic, or racial characteristics. In South African history, apartheid laws defined a binary caste system that assigned different rights (or lack thereof) and social spaces to Whites and Blacks, using skin color to automatically determine the opportunities available to individuals in each group.21
Analytical Discussion of Poverty in the United States
Poverty in the United States is cyclical in nature with roughly 13 to 17% living below the federal poverty line at any given point in time, and roughly 40% falling below the poverty line at some point within a 10-year time span.22 Most Americans (58.5%) will spend at least one year below the poverty line at some point between ages 25 and 75.23 There remains some controversy over whether the official poverty threshold over- or understates poverty.
The most common measure of poverty in the United States is the “poverty threshold” set by the U.S. government. This measure recognizes poverty as a lack of those goods and services commonly taken for granted by members of mainstream society.24 The official threshold is adjusted for inflation using the consumer price index.
The 2008–09 poverty threshold was measured according to the Department of Health and Human Services Poverty Guidelines which are illustrated in the table below.25
Table 1: Poverty Thresholds and Guidelines26
| Persons in Family Unit | Poverty Thresholds* | Poverty Guidelines | Alaska | Hawaii |
| 1 | $10,952 | $10,830 | $13,530 | $12,460 |
| 2 | 14,001 | 14,570 | 18,210 | 16,760 |
| 3 | 17,102 | 18,310 | 22,890 | 21,060 |
| 4 | 21,947 | 22,050 | 27,570 | 25,360 |
| 5 | 25,956 | 25,790 | 32,250 | 29,660 |
| 6 | 29,351 | 29,530 | 36,930 | 33,960 |
| 7 | 33,410 | 33,270 | 41,610 | 38,260 |
| 8 | 37,088 | 37,010 | 46,290 | 42,560 |
| For each add’l person add | 3,740 | 4,680 | 4,300 |
Poverty thresholds are used for calculating all official poverty population statistics, for instance, figures on the number of Americans in poverty each year. They are updated each year by the Census Bureau. The poverty guidelines are a simplified version of the federal poverty thresholds used for administrative purposes, for instance, determining financial eligibility for certain federal programs. They are issued each year in the Federal Register by the Department of Health and Human Services (HHS). The poverty guidelines are generally based on gross (before-tax) income, but some agencies and programs use the after-tax (net) income for determining if family units meet poverty guidelines.27
The poverty guidelines are more important primarily because a number of federal and state government programs use the guidelines (or percentage multiples of the guidelines, for instance, 125 percent or 185 percent of the guidelines) in determining eligibility. This includes Head Start, the Food Stamp Program, the National School Lunch Program, the Low-Income Home Energy Assistance Program, and the Children’s Health Insurance Program. Note that in general, cash public assistance programs (Temporary Assistance for Needy Families and Supplemental Security Income) and Earned Income Tax Credit program do not use the poverty guidelines in determining eligibility.28
Relative poverty describes how income relates to the median income, and does not imply that the person is lacking anything. In general, the United States has some of the highest relative poverty rates among industrialized countries, reflecting both the high median income and high degree of inequality.29 In terms of pre-transfer absolute poverty rates, in 2000 the U.S. ranked tenth among sixteen developed countries.30 The country does worse in post-transfer absolute poverty rates.31 According to a 2008 report released by the Carsey Institute at the University of New Hampshire, on average, rates of poverty are persistently higher in rural and inner city parts of the country as compared to suburban areas.32
Since the 1960s, the United States Government has defined poverty in absolute terms. When the Johnson administration declared “war on poverty” in 1964, it chose an absolute measure. The “absolute poverty line” is the threshold below which families or individuals are considered to be lacking the resources to meet the basic needs for healthy living; having insufficient income to provide the food, shelter and clothing needed to preserve health.33
The “Orshansky Poverty Thresholds” form the basis for the current measure of poverty in the U.S. Mollie Orshansky was an economist working for the Social Security Administration (SSA). Her work appeared at an opportune moment. Orshansky’s article was published later in the same year that Johnson declared war on poverty. Since her measure was absolute (i.e., did not depend on other events), it made it possible to objectively answer whether the government was “winning” this war. The newly formed United States Office of Economic Opportunity adopted the lower of the Orshansky poverty thresholds for statistical, planning, and budgetary purposes in May 1965.34
The Bureau of the Budget (now the Office of Management and Budget) adopted Orshansky’s definition for statistical use in all executive departments. The measure gave a range of income cutoffs, or thresholds, adjusted for factors such as family size, sex of the family head, number of children under eighteen years of age, and farm or non-farm residence. The economy food plan (the least costly of four nutritionally adequate food plans designed by the Department of Agriculture) was at the core of this definition of poverty.35
By contrast, the OECD uses a different measure for poverty, and declared in 2008 that child poverty in the United States is 20% and poverty among the elderly is 23%.36 According to a Feeding America study, 3.5 million children under the age of five are at risk of hunger in the United States. The study also states that in eleven states—Louisiana (which has the highest rate), followed by North Carolina, Ohio, Kentucky, Texas, New Mexico, Kansas, South Carolina, Tennessee, Idaho and Arkansas—more than 20 percent of children under five are allegedly at risk of going hungry.37
There are numerous factors related to poverty in the United States:
- Tax levels cross-country data shows an inverse correlation between tax levels as a share of GDP and child poverty. This conclusion is based on a comparison of high tax Scandinavian countries with the U.S. The poverty rate, however, is low in some low tax countries such as Switzerland. A comparison of poverty rates between states reveals that some low tax states have low poverty rates. For example, New Hampshire has the lowest poverty rate of any state in the U. S., and has very low taxes (46th among all states).38
- Income is directly related to educational leve In 2007, the median earnings of individuals with less than a 9th grade education was $16,615, while high school graduates earned $31,337, holders of bachelor’s degree earned $56,826, and individuals with professional degrees earned $100,000. In many cases poverty is caused by job loss. In 2007, the poverty rate was 21.5% for individuals who were unemployed, but only 2.5% for individuals who were employed full-time.39
- In 1991, 8.3% of children in two-parent families were likely to live in poverty; 19.6% of children lived with their father in single-parent families, and 47.1% with their mother in single-parent families.40
- Income levels vary along racial/ethnic lines: while 21% of all children in the United States live in poverty, about 46% of African American children and 40% of Latino children live in pove In 2007 only 11% of black women aged 30-44 without a high school diploma had a working spouse.41 Poverty rate for native-born and naturalized whites are identical (9.6%). On the other hand, the poverty rate for naturalized blacks is 11.8% compared to 25.1% for native-born blacks, suggesting race alone does not explain income disparity. Not all minorities have low incomes. For example, Asian families have higher average incomes than blacks and Hispanics, they have higher average incomes than white families. In 2005, for example, the median income of Asian families was $68,957, compared to the median income of white families at $59,124. Mean income of Asian families was $88,372 compared to the mean income of white families of $76,327.42 However, Asians report that they face discrimination more frequently than blacks. Specifically, 31% of Asians reported employment discrimination compared to 26% of blacks in 2005.43
- The Heritage Foundation reports that illegal immigration increases job competition among low wage earners, both native and foreign bo Additionally many first generation immigrants, namely those without a high school diploma, are also living in poverty themselves.44
Table 2: 2007 and 2008 Poverty Distribution by Region, Race and Age in the United States
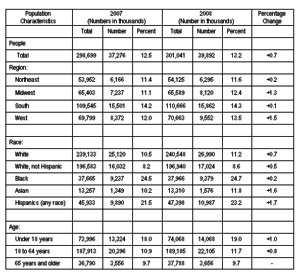 The data in the above table was obtained from the U.S. Census Bureau, Current Population Survey, 2008 and 2009 Annual Social Economic Supplements.
Highlights of Table 2
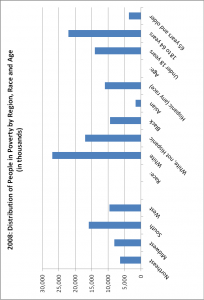
- In 2008, 39.9 million people in the United States were in poverty, up from 37.3 million in 2007.
- The poverty rate for Blacks was statistically unchanged.
- Poverty rate for non-Hispanic Whites was 8.6 percent in 2008, up from 8.2 percent in 2007.
- Hispanics and the Asian had the largest poverty rate increase in 2008.
- While there were more people living in the Southeast, there was no significant increase in poverty rate in this regi The West and Midwest had the highest poverty rate increase in 2008.
- Poverty rate in the 65 years and older age range was unchanged in 2008. People under eighteen had a poverty rate increase of 1.0 percent in 200
Figure 1: Graphic Representation of Poverty Distribution
Concerns Regarding Accuracy of Poverty Measurement in the United States
In recent years, there have been a number of concerns raised about the official U.S. poverty measure. In 1995, the National Research Council’s Committee on National Statistics convened a panel for measuring poverty. The findings of the panel stated that the official poverty measure in the United States is flawed and does not adequately inform policy-makers or the public who is poor and who is not.
The panel was chaired by Robert Michael, former Dean of the Harris School of the University of Chicago. According to Michael, the official U.S. poverty measure has not kept pace with far-reaching changes in society and the economy. The panel proposed a model based on disposable income:
According to the panel’s recommendation measure, income would include, in addition to money received, the value of non-cash benefits such as food stamps, school lunches and public housing that can be used to satisfy basic needs. The new measure also would subtract from gross income certain expenses that cannot be used for these basic needs, such as income taxes, child- support payments, medical costs, health-insurance premiums and work-related expenses, including child care.45
Much of the debate about poverty focuses on statistical measures of poverty and the clash between advocates and opponents of welfare programs and government regulation of the free market. Since measures can be either absolute or relative, it is possible that advocates for the different sides of this debate are basing their arguments on different ways of measuring poverty. It is often claimed that poverty is understated, yet there are some who also believe it is overstated; thus the accuracy of the current poverty threshold guidelines is subject to debate and considerable concern.
Summary/Conclusion
Human development is about much more than the rise or fall of national incomes. It is about creating an environment in which people can develop their full potential and lead productive, creative lives in accord with their needs and interests. People are the real wealth of nations. Development is thus about expanding the choices people have to lead lives that they value. And it is thus about much more than economic growth, which is only a means of enlarging people’s choices.46
Poverty and social exclusion can affect all age groups. It is multi-faceted and combating it requires a multi-policy response. This is reflected in the definition of poverty and social exclusion which the government first adopted in 1997:
People are living in poverty if their income and resources (material, cultural and social) are so inadequate as to preclude them from having a standard of living which is regarded as acceptable by Irish society generally. As a result of inadequate income and resources people may be excluded and marginalized from participating in activities which are considered the norm for other people in society.
This definition continues to be valid and underpins the Government’s strategic response to tackling poverty and social exclusion as set out in the National Action Plan for Social Inclusion 2007-2016.47
Building a more widespread commitment to overcoming poverty is an essential first step in overcoming poverty, and actions to address this are discussed below.
- Share the benefits of economic growth through an emphasis on more widespread employme The phenomenon of jobless economic growth that increases income inequalities and generates too few jobs for low income groups poses a serious threat to the well-being of many nations. Government policies should consider not only aggregate economic impact but also the distribution of employment. Socially responsible venture capital and microcredit initiatives can foster employment-generating businesses that complement the local culture and environment.48
- Corruption, both in government and business, places heavy cost on socie Businesses should enact, publicize and follow codes of conduct banning corruption on the part of their staff and directors. Citizens must demand greater transparency on the part of both government and the corporate sector and create reform movements where needed.49
- Broaden access to education and technology among marginalized groups, and especially among girls and w The educational attainment of women has strong bearing on the well-being of their families, and efforts to improve education for women and girls must be strengthened. At the same time, steps should be taken to ensure that the current revolution in information technology benefits marginalized groups. This must begin in school.50
- Improve government capacity to provide universal access to essential goods and services, including potable water, affordable food, primary health care, education, housing and other social service Governments around the world have made commitments to this through the 20/20 Initiative, which calls for 20% of national budgets and 20% of foreign aid to be spent on human services. But raising adequate resources through effective taxation and other mechanisms is often politically difficult. New mechanisms for public policy dialogue that enables citizens of all classes to recognize the benefit of universal access to key services must be put in place. Nonprofit groups and even corporations can provide essential support here, helping articulate a vision of a healthy society. These nongovernmental actors can also help in the actual provision of services.51
Endnotes
1 American Heritage Dictionary of the English Language, Fourth Edition (Boston: Houghton Mifflin, 2007).
2 “Growing Unequal?: Income Distribution and Poverty in OECD Countries,” Organization for Economic Cooperation and Development (www.oecd.org/dataoecd/47/2/41528678.pdf, 2008, accessed November 12, 2009).
3 “A Dollar a Day: Finding Solutions to Poverty,” Oracle ThinkQuest Education Foundation (http://library.thinkquest.org/05aug/00282/over_causes.htm, 2006, accessed November 12, 2009).
4 “Growing Unequal”, loc. cit.
5 Ibid.
6 Ibid.
7 Ibid.
8 Ibid.
9 Ibid.
10 Ibid.
11 Ibid.
12 Ibid.
13 Jeffrey Gettleman, “Africa’s Forever Wars: Why the Continent’s Conflicts Never End,” Foreign Policy March-April 2010.
14 “Climate Change and Agriculture in Africa,” (www.ceepa.co.za/Climate_Change/index, accessed December 10, 2009).
15 “Drought: The Creeping Disasters,” Earth Observatory (http://earthobservatory.nasa.gov/Features/DroughtFacts, accessed December 10, 2009).
16United States Department of Health and Human Services: “Natural Disasters” (www.hhs.gov/disasters/emergency/naturaldisasters/index, accessed April 20, 2010).
17 See Vincent B. Khapoya, The African Experience (Upper Saddle River, NJ; Prentice-Hall, 1998); Onwutalobi Anthony Claret, ―The After Effect of European Colonization on Africa People,‖ Center for Africa Libration, (www.codewit.com/claretprobofpresentafrican.php, 2009, accessed April 20, 2010); and Akashambatwa Mbikusita-Lewanika, “A History of Poverty: Trade, Investment and Underdevelopment,” Southern African Regional Poverty Network (www.sarpn.org.za/documents/d0001883/index.php, 2005, accessed March 12, 2010).
18 Francis M. Deng: “Ethnicity: An African Predicament,” The Brookings Institution (www.brookings.edu/articles/1997/summer_africa_deng.aspx, accessed March 12, 2010).
19 Vito Tanzi, “Corruption Around the World: Causes, Consequences, Scope, and Cures”. International Monetary Fund Staff Papers 45:559-94, n4, December 1998.
20 “Combating Environmental Degradation,” International Fund for Agricultural Development (www.ifad.org/events/past/hunger/envir.html, accessed March 12, 2010).
21 Stephen Whitefield and Matthew Loveless, “Social Inequality and Social Conflict over Democracy and the Market in the New Market Democracies of Central and Eastern Europe,” Paper presented at the Annual Meeting of the Midwest Political Science Association‘s 67th Annual National Conference, April 2, 2009 (www.allacademic.com//meta/p_mla_apa_research_citation/3/6/1/6/9/pages361699/p361699-1.php, accessed March 12, 2010).
22 Michael Zweig, What’s Class Got to Do With It? American Society in the Twenty-First Century (Ithaca, NY: Cornell University [ILR] Press, 2004).
23 J. S. Hacker, The Great Risk Shift: The New Insecurity and the Decline of the American Dream (New York City: Oxford University Press, 2006).
24 J. E. Schwartz, Freedom Reclaimed: Rediscovering the American Vision (Baltimore: G-University Press, 2005).
25 ‖The 2008 HHS Poverty Guidelines,‖ United States Department of Health and Human Services (http://aspe.hhs.gov/poverty/08poverty.shtml, accessed March 18, 2010).
26 Federal Register 74:4199-201, n14, January 23, 2009.
27 U.S. Department of Health and Human Services, loc. cit.
28 “Means’Tested Programs: Determining Financial Eligibility is Cumbersome and Can Be Simplified,” United States General Accounting Office (www.gao.gov/new.items/d0258.pdf, accessed March 18, 2010).
29 Stephanie Moller, David Bradley, Evelyne Huber, François Nielson, John D. Stephens, “Determinants of Relative Poverty in Advanced Capitalist Democracies,” American Sociological Review 68:22-51, n3, 2003.
30 Geranda Notten and Chris de Neubourg, “Poverty in Europe and the USA: Exchanging Official Measurement Methods,” Maastricht Graduate School of Governance Working Paper (http://papers.ssrn.com/sol3/papers.cfm?abstract_id=1095742, p. 38, August 1, 2007).
31 Lane Kenworthy, “Do Social-Welfare Policies Reduce Poverty? A Cross-National Assessment,” Social Forces 77:1119-39, n3, March 1999.
32 William P. O‘Hare and Sarah Savage, “Child Poverty High in Rural America,” Carsey Institute Fact Sheet No. 6, Summer 2007 (www.carseyinstitute.unh.edu/publications/FS_RuralChildPoverty_07.pdf, accessed November 30, 2009).
33 Robert Siegel, “Lyndon Johnson’s War on Poverty,” National Public Radio, January 8, 2004 (http://www.npr.org/templates/story/story.php?storyId=1589660, accessed November 30, 2009).
34 Gordon M. Fisher, Department of Health and Human Services, “The Development and History of the U.S. Poverty Thresholds—A Brief Overview” GSS/SSS Newsletter [Newsletter of the Government Statistics Section and the Social Statistics Section of the American Statistical Association], Winter 1997, 6-7.
35 “How the Census Bureau Measures Poverty,” United States Census Bureau (www.census.gov/hhes/www/poverty/povdef.html, accessed November 30, 2009).
36 Growing Unequal?, loc. cit.
37 “3.5M Kids Under 5 On Verge Of Going Hungry,” CBS News, May 7, 2009 (www.cbsnews.com/stories/2009/05/07/health/main4998190.shtml, accessed November 30, 2009).
38 Neil Brooks and Thaddeus Hwong, “The Social Benefits and Economic Costs of Taxation: A Comparison of High and Low-Tax Countries,” Canadian Centre for Public Alternatives 2009 (www.policyalternatives.ca/sites/default/files/uploads/publications/National_Office_Pubs/2006/Benefits_and_Costs_of_Taxation.pdf, accessed November 30, 2009).
39 “Income, Expenditure and Wealth,” United States Census Bureau (www.census.gov/prod/2009pubs/10statab/income.pdf, accessed November 30, 2009).
40 Ibid.
41 “Sex and the Single Black Woman,” The Economist, April 8, 2010 (www.economist.com/world/united- states/displaystory.cfm?story_id=15867956).
42 Philip Harvey, “Designing Policies to Combat Joblessness,” University of Missouri – Kansas City Department of Economics, Center for Full Employment and Price Stability, Seminar Paper No. 3 (2000).
43 “Family Income Tables,” United States Census Bureau (http://pubdb3.census.gov/macro/032006/faminc/toc.htm, accessed March 30, 2010).
44 Amy Joyce, “The Bias Breakdown,” The Washington Post, D1, December 9, 2005.
45 Robert Rector, “Importing Poverty: Immigration and Poverty in the United States: A Book of Charts,” (www.heritage.org/Research/Reports/2006/10/Importing-Poverty- Immigration-and-Poverty-in-the-United-States-A-Book-of-Charts#_ftn2, accessed March 30, 2010).
46 William Harms, “Poverty Definition Flawed, More Accurate Measure Needed,” The University of Chicago Chronicle 14, n17, May 11, 1995 (http://chronicle.uchicago.edu/950511/poverty.shtml, accessed March 30, 2010).
47 Anup Shah, “Poverty Around the World,” Global Issues (http://globalissues.org/article/4/poverty-around-the- world#Introduction, accessed March 30, 2010).
48 See National Action Plan for Social Inclusion 2007-2016 (Dublin, Ireland: The Stationery Office, Government Publications 2007; www.socialinclusion.ie/documents/NAPinclusionReportPDF.pdf, accessed March 30, 2010); Philip Harvey, “Designing Policies to Combat Joblessness,” University of Missouri – Kansas City Department of Economics, Center for Full Employment and Price Stability, Seminar Paper No. 3, March 2000; “Low-Income Working Families: Facts and Figures,” The Urban Institute, August 25, 2005 (www.urban.org/url.cfm?ID=900832, accessed March 30, 2010).
49 Anup Shah, “Causes of Poverty,” Global Issues (www.globalissues.org/issue/2/causes-of-poverty, accessed November 12, 2009).
50 Growing Unequal?, loc.cit.
51 See Richard Wilkinson, The Impact of Inequality: How to Make Sick Societies Healthier (New York City: The New Press, 2005), 146-148; Richard Wilkinson, Unhealthy Societies: The Afflictions of Inequality (New York: Routledge, 1996), 156; “Millennium Development Goals,” United Nations (www.un.org/millenniumgoals, accessed March 30, 2010).